Steps to Select Career Path Infographics Guide
Navigating a professional journey is rarely a straight line, yet presenting it often requires linear clarity. The Steps to Select Career Path Infographics collection addresses this specific design challenge by transforming abstract career development concepts into structured, visual narratives. For designers, educators, and content creators, these templates serve as more than just decorative elements; they are functional frameworks that organize complex decision-making processes into digestible data visualization. When you utilize a dedicated infographic template set for this niche, you move beyond generic stock art and provide your audience with a tangible roadmap for self-assessment and professional growth.
Visualizing the Assessment Phase
The foundation of any career change or advancement strategy begins with introspection. This is where the "Assess yourself" component of the workflow becomes critical. In design terms, representing self-assessment requires a balance between qualitative emotion and quantitative data. The templates in this collection facilitate this by offering modular layouts specifically designed for personality tests, skill gap analyses, and value alignment charts.
Rather than using a simple bulleted list to describe a SWOT analysis (Strengths, Weaknesses, Opportunities, Threats), consider adapting the process timeline info chart to map these attributes against potential career trajectories. For example, a radial diagram can place the individual at the center, with spokes representing different competencies. This approach turns a static assessment into a dynamic visual tool. Educators and career coaches can use these variations to help clients visualize their current standing before plotting future movements. The goal is to make the invisible internal work visible and actionable.
Data Visualization with Purposeful Steps
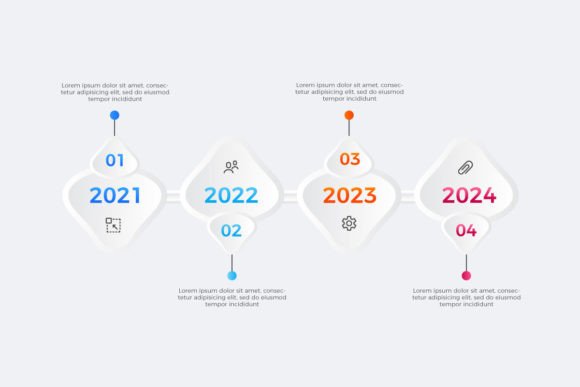
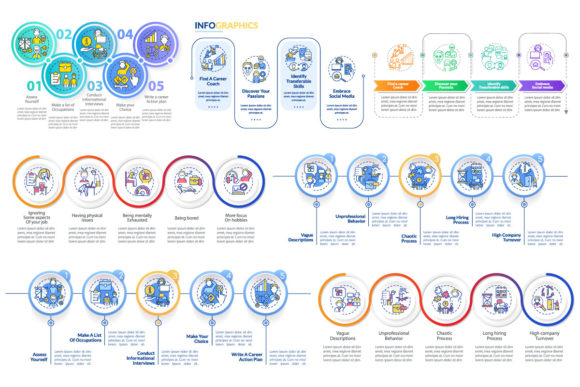
Effective career guidance relies on breaking down overwhelming decisions into manageable actions. The data visualization with steps included in this template set allows creators to sequence information logically. Whether illustrating a five-year plan or a three-month pivot strategy, the visual hierarchy guides the viewer’s eye from one milestone to the next without cognitive overload.
When applying these templates, focus on the relationship between the steps. Are they sequential, cyclical, or branching? A linear process timeline works best for certification paths or educational requirements, while a branching workflow layout suits entrepreneurial ventures or freelance portfolio building. By matching the visual structure to the actual nature of the career path, you enhance comprehension. Designers should leverage the clean line icons provided to represent each step distinctly, ensuring that the iconography supports the text rather than competing with it. This semantic consistency is what separates professional-grade infographics from cluttered decorations.
Typography and Technical Specifications
Aesthetic cohesion is paramount when creating educational or advisory content. This collection is built around a deliberate typographic pairing: Lato-Bold for headers and emphasis, and Myriad Pro-Regular for body copy. This combination offers exceptional legibility across both digital screens and printed brochures. Lato’s sturdy weight commands attention for key milestones and step numbers, while Myriad Pro’s neutral, humanist forms ensure that dense informational text remains approachable and easy to scan.
From a production standpoint, versatility defines utility. The product file formats include EPS, SVG, PNG, JPEG, and AI. This range ensures that whether you are designing a mobile app screen page, a high-resolution print brochure, or a web-optimized blog graphic, you have the appropriate asset. Vector formats like AI and SVG allow for infinite scaling and color customization, which is essential for maintaining brand consistency across different client projects. Raster formats like PNG and JPEG provide immediate usability for social media managers and bloggers who need quick, high-quality visuals without opening vector software.
Adapting Workflow Layouts for Diverse Audiences
The true value of the Steps to Select Career Path Infographic template set lies in its adaptability. Different audiences require different narrative pacing and visual density. Here is how various professionals can interpret these assets:
- HR Professionals and Recruiters: Use the workflow layout with line icons to create onboarding materials or internal mobility guides. Simplify the steps to focus on company-specific pathways, reducing anxiety for new hires exploring lateral moves.
- University Career Centers: Adapt the process timeline info chart for student workshops. Break down the "Assess yourself" phase into semester-based goals, making long-term planning feel immediate and relevant to academic life.
- Freelance Designers and Marketers: Utilize the templates as lead magnets or blog content. Create a "Career Pivot Checklist" downloadable PDF using the brochure infographic templates. This demonstrates expertise while providing genuine value to potential clients navigating their own transitions.
- Corporate Trainers: Integrate the mobile app screen pages into e-learning modules. The vertical orientation and touch-friendly icon sizing make these templates ideal for interactive training content consumed on tablets or phones.
Each adaptation maintains the core integrity of the original design while serving a unique functional purpose. This flexibility maximizes the return on investment for the template set, allowing a single purchase to fuel multiple campaigns or products.
Maintaining Clarity in Complex Narratives
While the templates provide a strong structural foundation, the creator must ensure the final output remains audience-friendly. Avoid the temptation to fill every negative space with text. Career planning is inherently dense; your design should offer breathing room. Use the line icons as visual anchors that allow the viewer to pause and process information between text blocks.
Consistency in color coding can also enhance navigation. Assign specific colors to different phases of the career selection process—for instance, blue for assessment, green for exploration, and orange for execution. This subtle cue helps users mentally categorize information as they move through the infographic. Furthermore, always test your variations for accessibility. Ensure sufficient contrast between the Lato-Bold headers and the background, and verify that the Myriad Pro-Regular body text meets minimum size requirements for readability. Originality comes not from reinventing the wheel, but from applying these professional standards to create clear, empathetic, and useful resources.
Expanding Your Creative Toolkit
Career development is just one facet of visual communication. At BSD Studio, we understand that creators need a diverse arsenal of assets to meet evolving client demands. Beyond career path infographics, we create icons, brochure infographic templates, mobile app screen pages, and comprehensive UI kits tailored for modern storytelling. Our library is updated weekly with new topics and exclusive discounts to keep your projects fresh and your budget intact.
Staying inspired requires a steady stream of high-quality references and tools. We encourage you to explore our broader catalog to find complementary assets that elevate your current projects. Whether you are building a personal brand, consulting for enterprises, or educating the next generation of professionals, having access to professionally crafted, editable templates accelerates your workflow and enhances your output quality. Subscribe on BSD Studio to be updated on the latest releases and ensure you never miss an opportunity to refine your visual communication strategy. Your creativity deserves tools that work as hard as you do.